| SPENDING CATEGORY |
FY2014 Expended |
FY2015 Expended |
FY2016 Expended |
FY2017 Projected |
FY2018 GAA |
|---|---|---|---|---|---|
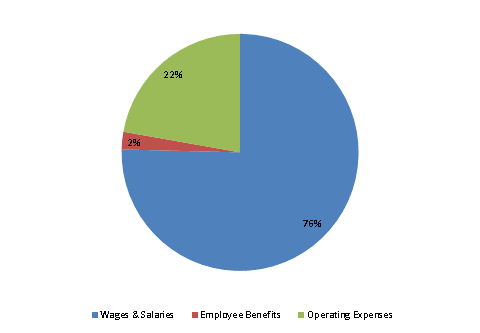
| Wages & Salaries | 8,672 | 9,385 | 10,030 | 10,041 | 10,866 |
| Employee Benefits | 357 | 314 | 315 | 357 | 344 |
| Operating Expenses | 3,045 | 3,006 | 2,916 | 3,320 | 3,202 |
| TOTAL | 12,073 | 12,705 | 13,260 | 13,718 | 14,412 |
FY2018 Spending Category Chart
