|
FY2018 House 1 |
FY2018 House Final |
FY2018 Senate Final |
FY2018 GAA |
|
|---|---|---|---|---|
| Budget Tracking | 19,694,608 | 19,694,608 | 19,694,608 | 19,694,607 |
|
FY2015 GAA |
FY2016 GAA |
FY2017 GAA |
FY2017 Projected |
FY2018 GAA |
|
|---|---|---|---|---|---|
| Historical Budget Levels | 19,120,979 | 18,778,714 | 19,694,608 | 18,530,055 | 19,694,607 |
* GAA is General Appropriation Act.
| SPENDING CATEGORY |
FY2014 Expended |
FY2015 Expended |
FY2016 Expended |
FY2017 Projected |
FY2018 GAA |
|---|---|---|---|---|---|
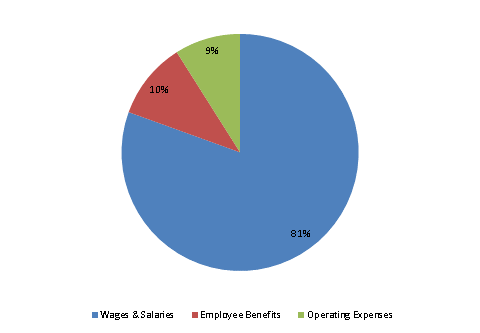
| Wages & Salaries | 16,707 | 16,868 | 16,965 | 15,863 | 15,858 |
| Employee Benefits | 331 | 366 | 363 | 1,439 | 2,070 |
| Operating Expenses | 340 | 2,894 | 525 | 1,228 | 1,767 |
| TOTAL | 17,377 | 20,129 | 17,854 | 18,530 | 19,695 |
FY2018 Spending Category Chart
