|
FY2018 House 1 |
FY2018 House Final |
FY2018 Senate Final |
FY2018 GAA |
|
|---|---|---|---|---|
| Budget Tracking | 7,257,869 | 7,257,795 | 7,270,169 | 7,268,675 |
|
FY2015 GAA |
FY2016 GAA |
FY2017 GAA |
FY2017 Projected |
FY2018 GAA |
|
|---|---|---|---|---|---|
| Historical Budget Levels | 7,378,317 | 7,253,316 | 7,256,375 | 7,255,368 | 7,268,675 |
* GAA is General Appropriation Act.
| SPENDING CATEGORY |
FY2014 Expended |
FY2015 Expended |
FY2016 Expended |
FY2017 Projected |
FY2018 GAA |
|---|---|---|---|---|---|
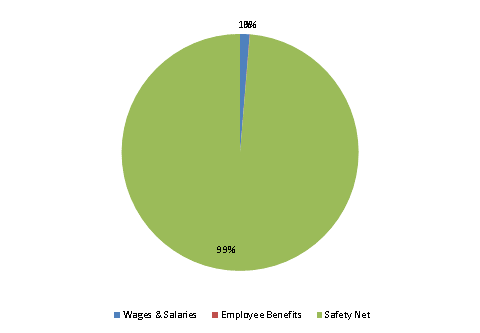
| Wages & Salaries | 73 | 89 | 91 | 92 | 94 |
| Employee Benefits | 3 | 4 | 4 | 4 | 4 |
| Operating Expenses | 41 | 48 | 0 | 0 | 0 |
| Safety Net | 6,244 | 7,012 | 6,951 | 7,160 | 7,171 |
| TOTAL | 6,361 | 7,153 | 7,046 | 7,255 | 7,269 |
FY2018 Spending Category Chart
