|
FY2018 House 1 |
FY2018 House Final |
FY2018 Senate Final |
FY2018 GAA |
|
|---|---|---|---|---|
| Budget Tracking | 29,207,918 | 29,457,918 | 29,207,919 | 28,661,688 |
|
FY2015 GAA |
FY2016 GAA |
FY2017 GAA |
FY2017 Projected |
FY2018 GAA |
|
|---|---|---|---|---|---|
| Historical Budget Levels | 22,810,663 | 23,173,139 | 28,048,120 | 28,331,062 | 28,661,688 |
* GAA is General Appropriation Act.
| SPENDING CATEGORY |
FY2014 Expended |
FY2015 Expended |
FY2016 Expended |
FY2017 Projected |
FY2018 GAA |
|---|---|---|---|---|---|
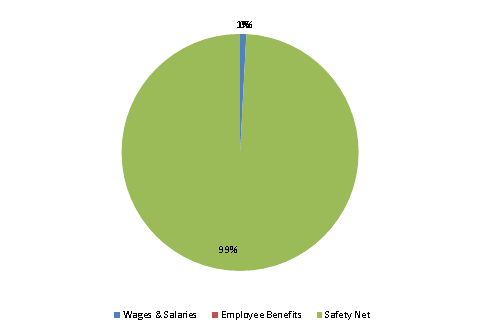
| Wages & Salaries | 236 | 238 | 165 | 186 | 239 |
| Employee Benefits | 5 | 6 | 5 | 6 | 5 |
| Operating Expenses | 114 | 112 | 0 | 0 | 0 |
| Safety Net | 21,582 | 22,406 | 23,063 | 28,140 | 28,417 |
| TOTAL | 21,937 | 22,762 | 23,232 | 28,331 | 28,662 |
FY2018 Spending Category Chart
