|
FY2018 House 1 |
FY2018 House Final |
FY2018 Senate Final |
FY2018 GAA |
|
|---|---|---|---|---|
| Budget Tracking | 174,184,360 | 174,184,359 | 175,384,360 | 173,749,706 |
|
FY2015 GAA |
FY2016 GAA |
FY2017 GAA |
FY2017 Projected |
FY2018 GAA |
|
|---|---|---|---|---|---|
| Historical Budget Levels | 104,411,964 | 106,667,534 | 102,570,589 | 113,609,584 | 173,749,706 |
* GAA is General Appropriation Act.
| SPENDING CATEGORY |
FY2014 Expended |
FY2015 Expended |
FY2016 Expended |
FY2017 Projected |
FY2018 GAA |
|---|---|---|---|---|---|
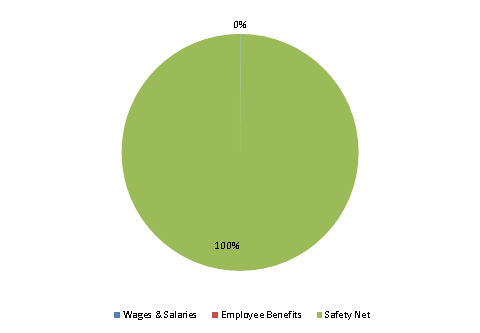
| Wages & Salaries | 95 | 98 | 100 | 102 | 103 |
| Employee Benefits | 2 | 2 | 3 | 3 | 3 |
| Safety Net | 99,483 | 104,326 | 104,991 | 113,505 | 173,644 |
| TOTAL | 99,580 | 104,426 | 105,094 | 113,610 | 173,750 |
FY2018 Spending Category Chart
