|
FY2018 House 1 |
FY2018 House Final |
FY2018 Senate Final |
FY2018 GAA |
|
|---|---|---|---|---|
| Budget Tracking | 2,087,778 | 2,087,777 | 2,087,778 | 2,076,565 |
|
FY2015 GAA |
FY2016 GAA |
FY2017 GAA |
FY2017 Projected |
FY2018 GAA |
|
|---|---|---|---|---|---|
| Historical Budget Levels | 2,197,063 | 2,343,832 | 2,076,565 | 2,052,012 | 2,076,565 |
* GAA is General Appropriation Act.
| SPENDING CATEGORY |
FY2014 Expended |
FY2015 Expended |
FY2016 Expended |
FY2017 Projected |
FY2018 GAA |
|---|---|---|---|---|---|
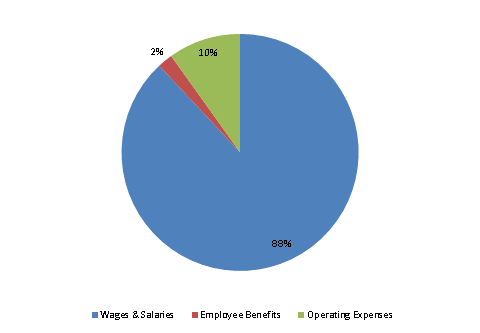
| Wages & Salaries | 1,829 | 1,947 | 1,783 | 1,803 | 1,829 |
| Employee Benefits | 37 | 42 | 40 | 43 | 43 |
| Operating Expenses | 195 | 191 | 194 | 206 | 205 |
| TOTAL | 2,061 | 2,180 | 2,018 | 2,052 | 2,077 |
FY2018 Spending Category Chart
