|
FY2018 House 1 |
FY2018 House Final |
FY2018 Senate Final |
FY2018 GAA |
|
|---|---|---|---|---|
| Budget Tracking | 60,732,891 | 54,580,830 | 57,633,087 | 54,580,830 |
|
FY2015 GAA |
FY2016 GAA |
FY2017 GAA |
FY2017 Projected |
FY2018 GAA |
|
|---|---|---|---|---|---|
| Historical Budget Levels | 53,149,805 | 54,051,129 | 53,510,618 | 60,137,473 | 54,580,830 |
* GAA is General Appropriation Act.
| SPENDING CATEGORY |
FY2014 Expended |
FY2015 Expended |
FY2016 Expended |
FY2017 Projected |
FY2018 GAA |
|---|---|---|---|---|---|
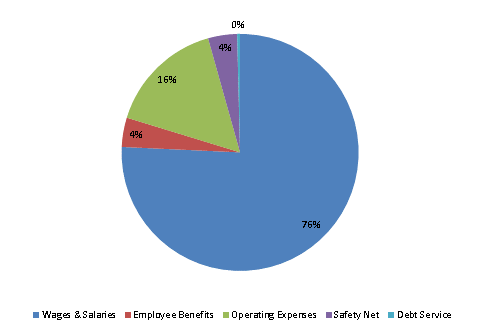
| Wages & Salaries | 33,012 | 42,527 | 44,180 | 45,405 | 41,337 |
| Employee Benefits | 992 | 2,143 | 2,239 | 2,419 | 2,178 |
| Operating Expenses | 4,767 | 10,916 | 11,950 | 9,668 | 8,689 |
| Safety Net | 570 | 2,641 | 2,505 | 2,404 | 2,160 |
| Grants & Subsidies | 2,100 | 0 | 0 | 0 | 0 |
| Debt Service | 0 | 0 | 0 | 241 | 216 |
| TOTAL | 41,441 | 58,226 | 60,874 | 60,137 | 54,581 |
FY2018 Spending Category Chart
