|
FY2018 House 1 |
FY2018 House Final |
FY2018 Senate Final |
FY2018 GAA |
|
|---|---|---|---|---|
| Budget Tracking | 35,813,669 | 30,938,585 | 33,468,139 | 30,938,585 |
|
FY2015 GAA |
FY2016 GAA |
FY2017 GAA |
FY2017 Projected |
FY2018 GAA |
|
|---|---|---|---|---|---|
| Historical Budget Levels | 29,823,394 | 35,855,393 | 30,331,946 | 35,462,555 | 30,938,585 |
* GAA is General Appropriation Act.
| SPENDING CATEGORY |
FY2014 Expended |
FY2015 Expended |
FY2016 Expended |
FY2017 Projected |
FY2018 GAA |
|---|---|---|---|---|---|
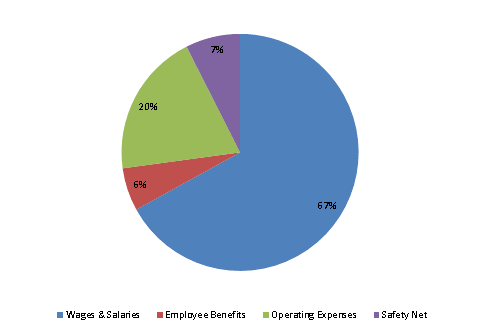
| Wages & Salaries | 22,175 | 23,204 | 22,815 | 21,687 | 20,723 |
| Employee Benefits | 1,844 | 2,077 | 2,051 | 2,090 | 1,813 |
| Operating Expenses | 5,601 | 5,182 | 7,944 | 9,014 | 6,094 |
| Safety Net | 2,410 | 1,860 | 2,460 | 2,672 | 2,308 |
| TOTAL | 32,029 | 32,324 | 35,270 | 35,463 | 30,939 |
FY2018 Spending Category Chart
