|
FY2018 House 1 |
FY2018 House Final |
FY2018 Senate Final |
FY2018 GAA |
|
|---|---|---|---|---|
| Budget Tracking | 765,348 | 780,655 | 765,348 | 765,348 |
|
FY2015 GAA |
FY2016 GAA |
FY2017 GAA |
FY2017 Projected |
FY2018 GAA |
|
|---|---|---|---|---|---|
| Historical Budget Levels | 772,328 | 773,079 | 765,348 | 689,552 | 765,348 |
* GAA is General Appropriation Act.
| SPENDING CATEGORY |
FY2014 Expended |
FY2015 Expended |
FY2016 Expended |
FY2017 Projected |
FY2018 GAA |
|---|---|---|---|---|---|
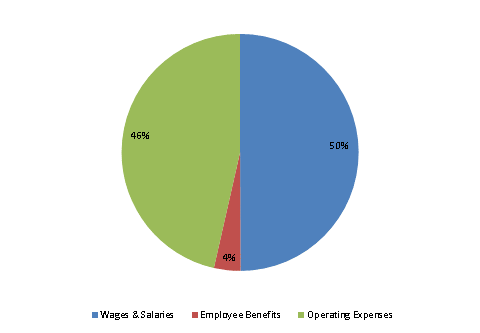
| Wages & Salaries | 223 | 259 | 286 | 302 | 382 |
| Employee Benefits | 4 | 5 | 6 | 28 | 28 |
| Operating Expenses | 320 | 308 | 335 | 360 | 356 |
| TOTAL | 547 | 573 | 628 | 690 | 765 |
FY2018 Spending Category Chart
