|
FY2018 House 1 |
FY2018 House Final |
FY2018 Senate Final |
FY2018 GAA |
|
|---|---|---|---|---|
| Budget Tracking | 3,045,620 | 2,944,524 | 2,976,247 | 2,944,524 |
|
FY2015 GAA |
FY2016 GAA |
FY2017 GAA |
FY2017 Projected |
FY2018 GAA |
|
|---|---|---|---|---|---|
| Historical Budget Levels | 2,915,947 | 2,915,947 | 2,886,788 | 3,015,761 | 2,944,524 |
* GAA is General Appropriation Act.
| SPENDING CATEGORY |
FY2014 Expended |
FY2015 Expended |
FY2016 Expended |
FY2017 Projected |
FY2018 GAA |
|---|---|---|---|---|---|
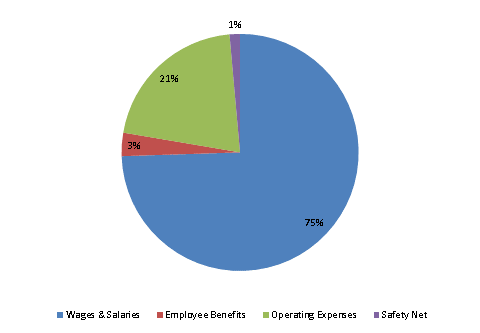
| Wages & Salaries | 2,267 | 2,340 | 2,270 | 2,238 | 2,193 |
| Employee Benefits | 50 | 48 | 46 | 98 | 94 |
| Operating Expenses | 538 | 505 | 691 | 637 | 616 |
| Safety Net | 41 | 40 | 30 | 43 | 42 |
| TOTAL | 2,896 | 2,933 | 3,037 | 3,016 | 2,945 |
FY2018 Spending Category Chart
