|
FY2018 House 1 |
FY2018 House Final |
FY2018 Senate Final |
FY2018 GAA |
|
|---|---|---|---|---|
| Budget Tracking | 50,672,001 | 44,180,817 | 47,244,170 | 44,180,817 |
|
FY2015 GAA |
FY2016 GAA |
FY2017 GAA |
FY2017 Projected |
FY2018 GAA |
|
|---|---|---|---|---|---|
| Historical Budget Levels | 38,294,679 | 41,740,253 | 43,314,526 | 49,697,540 | 44,180,817 |
* GAA is General Appropriation Act.
| SPENDING CATEGORY |
FY2014 Expended |
FY2015 Expended |
FY2016 Expended |
FY2017 Projected |
FY2018 GAA |
|---|---|---|---|---|---|
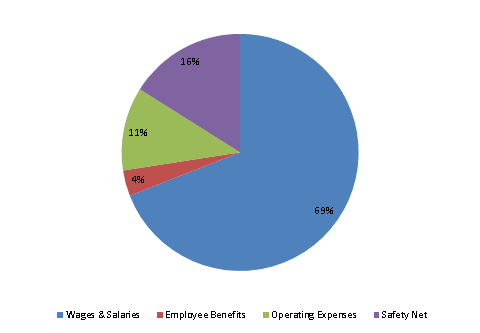
| Wages & Salaries | 31,529 | 32,256 | 33,804 | 33,985 | 30,510 |
| Employee Benefits | 1,490 | 1,420 | 1,591 | 1,770 | 1,541 |
| Operating Expenses | 4,168 | 5,642 | 5,534 | 5,806 | 5,035 |
| Safety Net | 372 | 2,382 | 7,793 | 8,137 | 7,095 |
| TOTAL | 37,559 | 41,701 | 48,723 | 49,698 | 44,181 |
FY2018 Spending Category Chart
