|
FY2018 House 1 |
FY2018 House Final |
FY2018 Senate Final |
FY2018 GAA |
|
|---|---|---|---|---|
| Budget Tracking | 28,867,116 | 28,336,117 | 28,386,872 | 28,336,117 |
|
FY2015 GAA |
FY2016 GAA |
FY2017 GAA |
FY2017 Projected |
FY2018 GAA |
|
|---|---|---|---|---|---|
| Historical Budget Levels | 27,132,798 | 28,239,453 | 27,780,507 | 28,584,105 | 28,336,117 |
* GAA is General Appropriation Act.
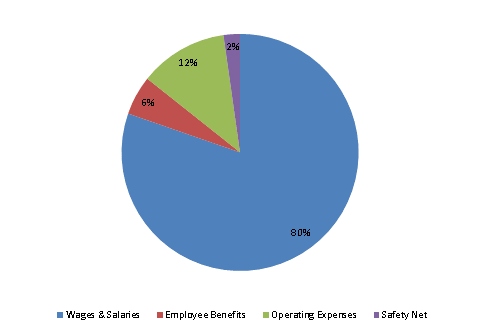
| SPENDING CATEGORY |
FY2014 Expended |
FY2015 Expended |
FY2016 Expended |
FY2017 Projected |
FY2018 GAA |
|---|---|---|---|---|---|
| Wages & Salaries | 22,226 | 22,779 | 22,301 | 22,911 | 22,756 |
| Employee Benefits | 1,476 | 1,561 | 1,578 | 1,546 | 1,520 |
| Operating Expenses | 2,938 | 3,236 | 3,660 | 3,479 | 3,424 |
| Safety Net | 409 | 617 | 763 | 648 | 636 |
| TOTAL | 27,049 | 28,193 | 28,302 | 28,584 | 28,336 |
FY2018 Spending Category Chart