|
FY2018 House 1 |
FY2018 House Final |
FY2018 Senate Final |
FY2018 GAA |
|
|---|---|---|---|---|
| Budget Tracking | 2,981,268 | 2,981,268 | 2,981,268 | 2,981,268 |
|
FY2015 GAA |
FY2016 GAA |
FY2017 GAA |
FY2017 Projected |
FY2018 GAA |
|
|---|---|---|---|---|---|
| Historical Budget Levels | 2,990,332 | 3,088,245 | 2,981,268 | 2,773,726 | 2,981,268 |
* GAA is General Appropriation Act.
| SPENDING CATEGORY |
FY2014 Expended |
FY2015 Expended |
FY2016 Expended |
FY2017 Projected |
FY2018 GAA |
|---|---|---|---|---|---|
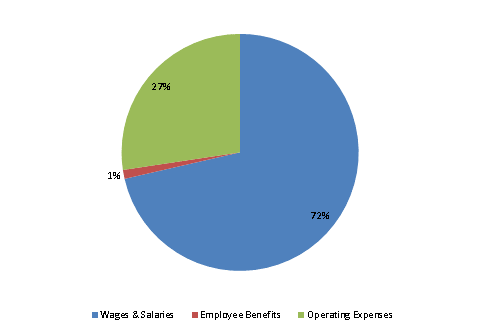
| Wages & Salaries | 1,968 | 2,137 | 1,956 | 1,922 | 2,129 |
| Employee Benefits | 33 | 37 | 38 | 36 | 36 |
| Operating Expenses | 601 | 564 | 532 | 816 | 816 |
| TOTAL | 2,602 | 2,738 | 2,526 | 2,774 | 2,981 |
FY2018 Spending Category Chart
