|
FY2018 House 1 |
FY2018 House Final |
FY2018 Senate Final |
FY2018 GAA |
|
|---|---|---|---|---|
| Budget Tracking | 18,020,016 | 17,912,744 | 17,813,281 | 17,813,281 |
|
FY2015 GAA |
FY2016 GAA |
FY2017 GAA |
FY2017 Projected |
FY2018 GAA |
|
|---|---|---|---|---|---|
| Historical Budget Levels | 17,306,275 | 17,306,274 | 17,561,543 | 17,843,349 | 17,813,281 |
* GAA is General Appropriation Act.
| SPENDING CATEGORY |
FY2014 Expended |
FY2015 Expended |
FY2016 Expended |
FY2017 Projected |
FY2018 GAA |
|---|---|---|---|---|---|
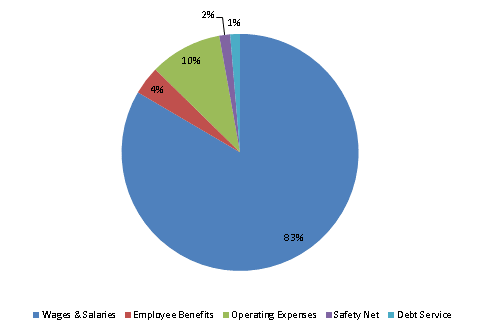
| Wages & Salaries | 12,972 | 13,904 | 14,134 | 14,862 | 14,866 |
| Employee Benefits | 813 | 612 | 670 | 698 | 691 |
| Operating Expenses | 2,831 | 2,619 | 2,425 | 1,774 | 1,754 |
| Safety Net | 235 | 178 | 196 | 268 | 265 |
| Debt Service | 0 | 0 | 241 | 241 | 238 |
| TOTAL | 16,850 | 17,314 | 17,667 | 17,843 | 17,813 |
FY2018 Spending Category Chart
