|
FY2018 House 1 |
FY2018 House Final |
FY2018 Senate Final |
FY2018 GAA |
|
|---|---|---|---|---|
| Budget Tracking | 14,611,662 | 13,978,512 | 14,344,504 | 14,165,464 |
|
FY2015 GAA |
FY2016 GAA |
FY2017 GAA |
FY2017 Projected |
FY2018 GAA |
|
|---|---|---|---|---|---|
| Historical Budget Levels | 13,298,440 | 13,298,440 | 13,704,424 | 14,330,669 | 14,165,464 |
* GAA is General Appropriation Act.
| SPENDING CATEGORY |
FY2014 Expended |
FY2015 Expended |
FY2016 Expended |
FY2017 Projected |
FY2018 GAA |
|---|---|---|---|---|---|
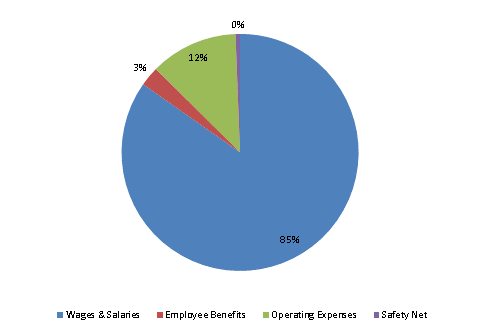
| Wages & Salaries | 10,713 | 11,312 | 11,744 | 12,104 | 12,005 |
| Employee Benefits | 333 | 381 | 376 | 389 | 379 |
| Operating Expenses | 2,123 | 1,794 | 1,840 | 1,748 | 1,694 |
| Safety Net | 215 | 326 | 90 | 90 | 87 |
| TOTAL | 13,383 | 13,812 | 14,050 | 14,331 | 14,165 |
FY2018 Spending Category Chart
