|
FY2018 House 1 |
FY2018 House Final |
FY2018 Senate Final |
FY2018 GAA |
|
|---|---|---|---|---|
| Budget Tracking | 69,075,443 | 68,042,894 | 68,275,072 | 68,275,072 |
|
FY2015 GAA |
FY2016 GAA |
FY2017 GAA |
FY2017 Projected |
FY2018 GAA |
|
|---|---|---|---|---|---|
| Historical Budget Levels | 64,958,580 | 70,310,139 | 66,708,720 | 68,398,233 | 68,275,072 |
* GAA is General Appropriation Act.
| SPENDING CATEGORY |
FY2014 Expended |
FY2015 Expended |
FY2016 Expended |
FY2017 Projected |
FY2018 GAA |
|---|---|---|---|---|---|
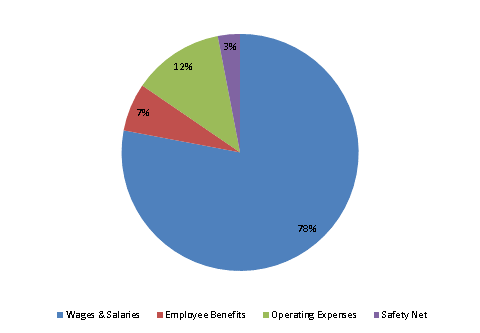
| Wages & Salaries | 51,586 | 50,528 | 51,493 | 53,053 | 53,233 |
| Employee Benefits | 3,987 | 4,433 | 4,692 | 4,535 | 4,489 |
| Operating Expenses | 7,960 | 9,739 | 9,588 | 8,723 | 8,489 |
| Safety Net | 2,439 | 2,337 | 2,005 | 2,088 | 2,064 |
| TOTAL | 65,973 | 67,037 | 67,778 | 68,398 | 68,275 |
FY2018 Spending Category Chart
