|
FY2018 House 1 |
FY2018 House Final |
FY2018 Senate Final |
FY2018 GAA |
|
|---|---|---|---|---|
| Budget Tracking | 51,133,585 | 46,374,644 | 49,863,241 | 46,374,644 |
|
FY2015 GAA |
FY2016 GAA |
FY2017 GAA |
FY2017 Projected |
FY2018 GAA |
|
|---|---|---|---|---|---|
| Historical Budget Levels | 44,586,199 | 45,424,583 | 45,465,337 | 50,150,247 | 46,374,644 |
* GAA is General Appropriation Act.
| SPENDING CATEGORY |
FY2014 Expended |
FY2015 Expended |
FY2016 Expended |
FY2017 Projected |
FY2018 GAA |
|---|---|---|---|---|---|
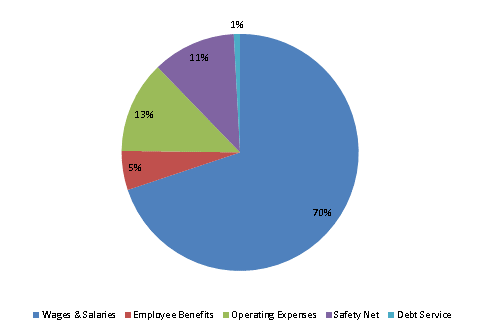
| Wages & Salaries | 28,687 | 30,333 | 31,180 | 35,083 | 32,396 |
| Employee Benefits | 2,240 | 2,404 | 2,532 | 2,729 | 2,479 |
| Operating Expenses | 6,845 | 6,924 | 7,060 | 6,082 | 5,826 |
| Safety Net | 5,428 | 5,826 | 5,829 | 5,819 | 5,277 |
| Debt Service | 437 | 437 | 437 | 437 | 396 |
| TOTAL | 43,637 | 45,924 | 47,038 | 50,150 | 46,375 |
FY2018 Spending Category Chart
