|
FY2018 House 1 |
FY2018 House Final |
FY2018 Senate Final |
FY2018 GAA |
|
|---|---|---|---|---|
| Budget Tracking | 72,934,809 | 72,376,634 | 72,046,553 | 72,046,553 |
|
FY2015 GAA |
FY2016 GAA |
FY2017 GAA |
FY2017 Projected |
FY2018 GAA |
|
|---|---|---|---|---|---|
| Historical Budget Levels | 69,517,654 | 71,076,757 | 70,957,484 | 72,219,762 | 72,046,553 |
* GAA is General Appropriation Act.
| SPENDING CATEGORY |
FY2014 Expended |
FY2015 Expended |
FY2016 Expended |
FY2017 Projected |
FY2018 GAA |
|---|---|---|---|---|---|
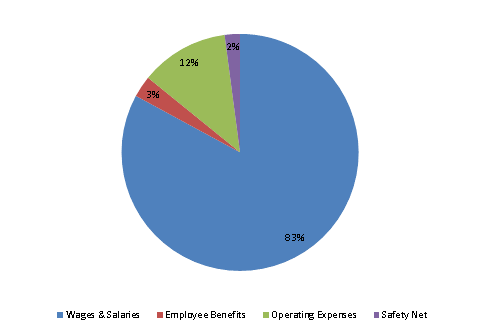
| Wages & Salaries | 56,502 | 57,911 | 59,510 | 59,745 | 59,732 |
| Employee Benefits | 1,762 | 1,915 | 2,189 | 2,131 | 2,112 |
| Operating Expenses | 9,577 | 8,471 | 8,563 | 8,819 | 8,696 |
| Safety Net | 1,474 | 1,500 | 1,309 | 1,525 | 1,506 |
| TOTAL | 69,314 | 69,797 | 71,570 | 72,220 | 72,047 |
FY2018 Spending Category Chart
