|
FY2018 House 1 |
FY2018 House Final |
FY2018 Senate Final |
FY2018 GAA |
|
|---|---|---|---|---|
| Budget Tracking | 280,832,693 | 282,251,103 | 279,922,693 | 281,420,645 |
|
FY2015 GAA |
FY2016 GAA |
FY2017 GAA |
FY2017 Projected |
FY2018 GAA |
|
|---|---|---|---|---|---|
| Historical Budget Levels | 265,239,069 | 265,509,501 | 284,896,142 | 271,923,332 | 281,420,645 |
* GAA is General Appropriation Act.
| SPENDING CATEGORY |
FY2014 Expended |
FY2015 Expended |
FY2016 Expended |
FY2017 Projected |
FY2018 GAA |
|---|---|---|---|---|---|
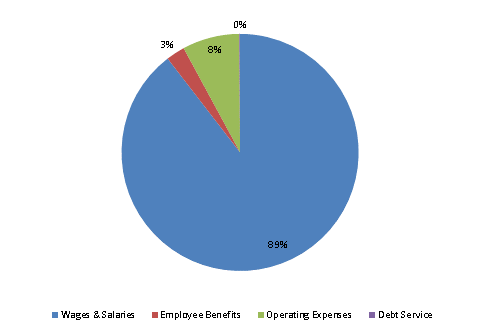
| Wages & Salaries | 230,631 | 243,748 | 247,366 | 245,962 | 251,967 |
| Employee Benefits | 5,813 | 6,359 | 7,086 | 7,057 | 7,225 |
| Operating Expenses | 24,046 | 19,539 | 18,373 | 18,508 | 21,891 |
| Safety Net | 0 | 0 | 20 | 0 | 0 |
| Grants & Subsidies | 40 | 0 | 46 | 60 | 0 |
| Debt Service | 222 | 0 | 337 | 337 | 338 |
| TOTAL | 260,753 | 269,647 | 273,228 | 271,923 | 281,421 |
FY2018 Spending Category Chart
