|
FY2018 House 1 |
FY2018 House Final |
FY2018 Senate Final |
FY2018 GAA |
|
|---|---|---|---|---|
| Budget Tracking | 31,250,000 | 31,250,000 | 31,250,000 | 31,250,000 |
|
FY2015 GAA |
FY2016 GAA |
FY2017 GAA |
FY2017 Projected |
FY2018 GAA |
|
|---|---|---|---|---|---|
| Historical Budget Levels | 27,500,000 | 27,500,000 | 27,500,000 | 26,192,653 | 31,250,000 |
* GAA is General Appropriation Act.
| SPENDING CATEGORY |
FY2014 Expended |
FY2015 Expended |
FY2016 Expended |
FY2017 Projected |
FY2018 GAA |
|---|---|---|---|---|---|
| Wages & Salaries | 20,080 | 22,527 | 24,736 | 25,693 | 30,750 |
| Employee Benefits | 285 | 358 | 408 | 448 | 448 |
| Operating Expenses | 7 | 15 | 96 | 52 | 52 |
| TOTAL | 20,372 | 22,900 | 25,240 | 26,193 | 31,250 |
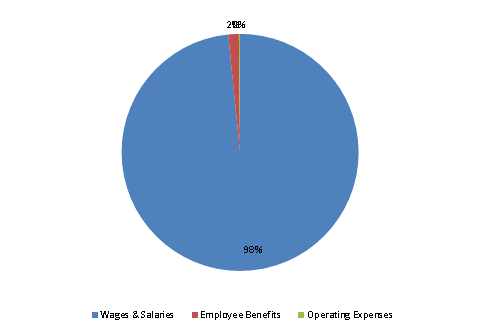
FY2018 Spending Category Chart