|
FY2018 House 1 |
FY2018 House Final |
FY2018 Senate Final |
FY2018 GAA |
|
|---|---|---|---|---|
| Budget Tracking | 21,174,138 | 21,174,138 | 21,652,338 | 21,174,138 |
|
FY2015 GAA |
FY2016 GAA |
FY2017 GAA |
FY2017 Projected |
FY2018 GAA |
|
|---|---|---|---|---|---|
| Historical Budget Levels | 19,760,055 | 20,227,372 | 20,742,077 | 20,742,077 | 21,174,138 |
* GAA is General Appropriation Act.
| SPENDING CATEGORY |
FY2014 Expended |
FY2015 Expended |
FY2016 Expended |
FY2017 Projected |
FY2018 GAA |
|---|---|---|---|---|---|
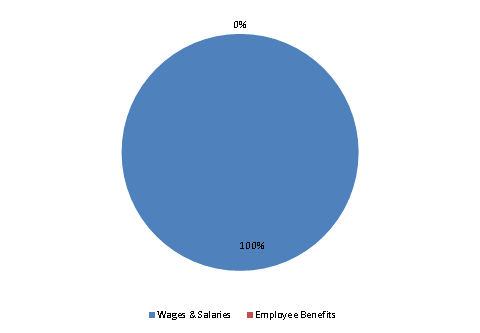
| Wages & Salaries | 18,606 | 19,583 | 19,908 | 20,739 | 21,170 |
| Employee Benefits | 264 | 311 | 328 | 3 | 4 |
| TOTAL | 18,870 | 19,894 | 20,236 | 20,742 | 21,174 |
FY2018 Spending Category Chart
