|
FY2018 House 1 |
FY2018 House Final |
FY2018 Senate Final |
FY2018 GAA |
|
|---|---|---|---|---|
| Budget Tracking | 12,311,578 | 12,311,578 | 12,551,412 | 12,311,578 |
|
FY2015 GAA |
FY2016 GAA |
FY2017 GAA |
FY2017 Projected |
FY2018 GAA |
|
|---|---|---|---|---|---|
| Historical Budget Levels | 11,014,636 | 11,365,077 | 12,096,928 | 12,096,928 | 12,311,578 |
* GAA is General Appropriation Act.
| SPENDING CATEGORY |
FY2014 Expended |
FY2015 Expended |
FY2016 Expended |
FY2017 Projected |
FY2018 GAA |
|---|---|---|---|---|---|
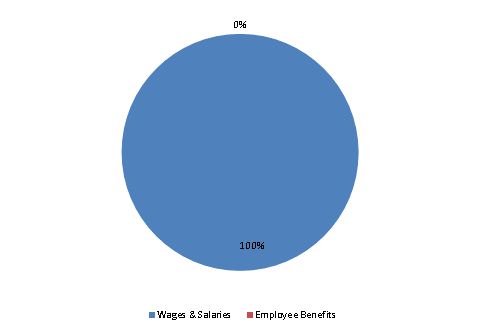
| Wages & Salaries | 10,388 | 10,904 | 11,080 | 12,096 | 12,310 |
| Employee Benefits | 147 | 173 | 183 | 1 | 2 |
| Operating Expenses | 1 | 7 | 112 | 0 | 0 |
| TOTAL | 10,537 | 11,084 | 11,374 | 12,097 | 12,312 |
FY2018 Spending Category Chart
