|
FY2018 House 1 |
FY2018 House Final |
FY2018 Senate Final |
FY2018 GAA |
|
|---|---|---|---|---|
| Budget Tracking | 16,319,534 | 16,319,534 | 16,813,607 | 16,319,534 |
|
FY2015 GAA |
FY2016 GAA |
FY2017 GAA |
FY2017 Projected |
FY2018 GAA |
|
|---|---|---|---|---|---|
| Historical Budget Levels | 14,779,296 | 15,448,258 | 16,158,085 | 16,158,085 | 16,319,534 |
* GAA is General Appropriation Act.
| SPENDING CATEGORY |
FY2014 Expended |
FY2015 Expended |
FY2016 Expended |
FY2017 Projected |
FY2018 GAA |
|---|---|---|---|---|---|
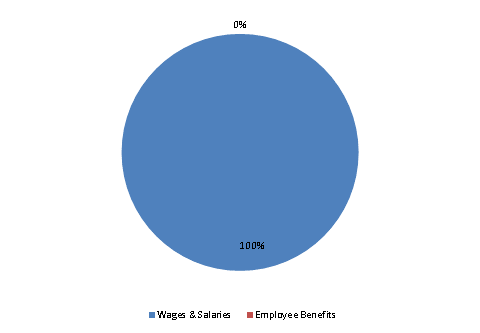
| Wages & Salaries | 14,572 | 14,861 | 15,324 | 16,156 | 16,317 |
| Employee Benefits | 207 | 236 | 253 | 2 | 3 |
| TOTAL | 14,779 | 15,097 | 15,577 | 16,158 | 16,320 |
FY2018 Spending Category Chart
