|
FY2018 House 1 |
FY2018 House Final |
FY2018 Senate Final |
FY2018 GAA |
|
|---|---|---|---|---|
| Budget Tracking | 2,756,538 | 2,750,000 | 2,750,000 | 2,550,000 |
|
FY2015 GAA |
FY2016 GAA |
FY2017 GAA |
FY2017 Projected |
FY2018 GAA |
|
|---|---|---|---|---|---|
| Historical Budget Levels | 3,250,000 | 4,256,503 | 2,750,000 | 1,781,063 | 2,550,000 |
* GAA is General Appropriation Act.
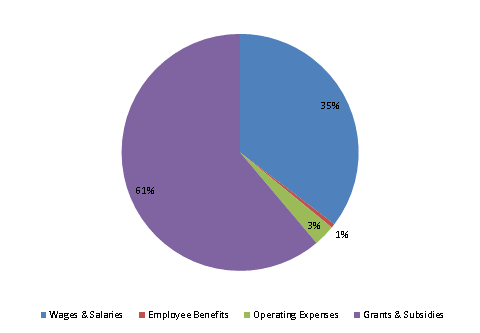
| SPENDING CATEGORY |
FY2014 Expended |
FY2015 Expended |
FY2016 Expended |
FY2017 Projected |
FY2018 GAA |
|---|---|---|---|---|---|
| Wages & Salaries | 3,910 | 3,687 | 1,891 | 963 | 902 |
| Employee Benefits | 87 | 90 | 43 | 20 | 14 |
| Operating Expenses | 1,125 | 779 | 318 | 81 | 75 |
| Safety Net | 113 | 103 | 54 | 0 | 0 |
| Grants & Subsidies | 145 | 141 | 210 | 717 | 1,559 |
| TOTAL | 5,380 | 4,800 | 2,516 | 1,781 | 2,550 |
FY2018 Spending Category Chart