|
FY2018 House 1 |
FY2018 House Final |
FY2018 Senate Final |
FY2018 GAA |
|
|---|---|---|---|---|
| Budget Tracking | 1,836,684 | 2,836,684 | 4,354,762 | 3,976,583 |
|
FY2015 GAA |
FY2016 GAA |
FY2017 GAA |
FY2017 Projected |
FY2018 GAA |
|
|---|---|---|---|---|---|
| Historical Budget Levels | 3,249,334 | 2,591,476 | 3,041,274 | 3,689,236 | 3,976,583 |
* GAA is General Appropriation Act.
| SPENDING CATEGORY |
FY2014 Expended |
FY2015 Expended |
FY2016 Expended |
FY2017 Projected |
FY2018 GAA |
|---|---|---|---|---|---|
| Wages & Salaries | 2,088 | 1,943 | 1,927 | 1,754 | 3,470 |
| Employee Benefits | 64 | 65 | 65 | 76 | 186 |
| Operating Expenses | 59 | 144 | 81 | 142 | 320 |
| Safety Net | 1,000 | 500 | 1,000 | 1,000 | 0 |
| Grants & Subsidies | 100 | 0 | 0 | 717 | 0 |
| TOTAL | 3,311 | 2,651 | 3,072 | 3,689 | 3,977 |
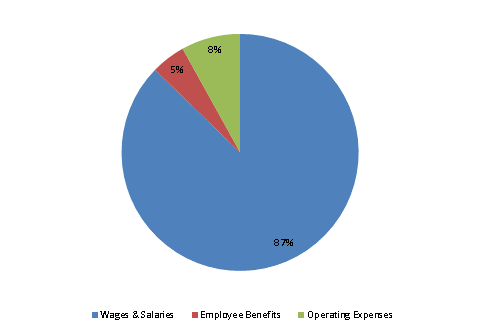
FY2018 Spending Category Chart