|
FY2018 House 1 |
FY2018 House Final |
FY2018 Senate Final |
FY2018 GAA |
|
|---|---|---|---|---|
| Budget Tracking | 0 | 14,175,592 | 14,175,592 | 13,975,592 |
|
FY2015 GAA |
FY2016 GAA |
FY2017 GAA |
FY2017 Projected |
FY2018 GAA |
|
|---|---|---|---|---|---|
| Historical Budget Levels | 14,668,628 | 14,673,492 | 14,174,528 | 14,144,231 | 13,975,592 |
* GAA is General Appropriation Act.
| SPENDING CATEGORY |
FY2014 Expended |
FY2015 Expended |
FY2016 Expended |
FY2017 Projected |
FY2018 GAA |
|---|---|---|---|---|---|
| Wages & Salaries | 95 | 131 | 118 | 145 | 133 |
| Employee Benefits | 1 | 3 | 3 | 4 | 3 |
| Grants & Subsidies | 14,111 | 14,474 | 14,127 | 13,995 | 13,839 |
| Debt Service | 0 | 0 | 0 | 0 | 0 |
| TOTAL | 14,207 | 14,607 | 14,248 | 14,144 | 13,976 |
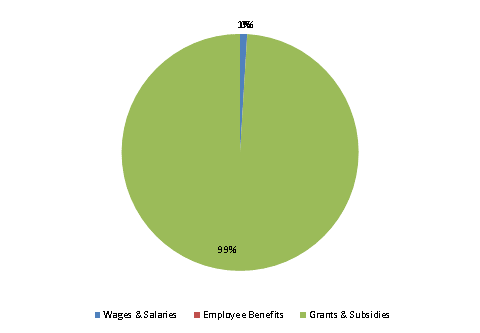
FY2018 Spending Category Chart