|
FY2018 House 1 |
FY2018 House Final |
FY2018 Senate Final |
FY2018 GAA |
|
|---|---|---|---|---|
| Budget Tracking | 890,322 | 890,323 | 890,322 | 890,322 |
|
FY2015 GAA |
FY2016 GAA |
FY2017 GAA |
FY2017 Projected |
FY2018 GAA |
|
|---|---|---|---|---|---|
| Historical Budget Levels | 979,650 | 0 | 890,322 | 876,122 | 890,322 |
* GAA is General Appropriation Act.
| SPENDING CATEGORY |
FY2014 Expended |
FY2015 Expended |
FY2016 Expended |
FY2017 Projected |
FY2018 GAA |
|---|---|---|---|---|---|
| Wages & Salaries | 926 | 966 | 824 | 865 | 879 |
| Employee Benefits | 11 | 12 | 11 | 11 | 11 |
| Operating Expenses | 0 | 0 | 0 | 0 | 0 |
| Debt Service | 0 | 0 | 0 | 0 | 0 |
| TOTAL | 937 | 978 | 835 | 876 | 890 |
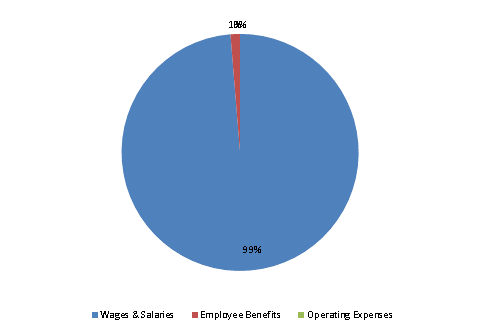
FY2018 Spending Category Chart