|
FY2018 House 1 |
FY2018 House Final |
FY2018 Senate Final |
FY2018 GAA |
|
|---|---|---|---|---|
| Budget Tracking | 277,281,180 | 281,281,181 | 294,390,396 | 281,231,181 |
|
FY2015 GAA |
FY2016 GAA |
FY2017 GAA |
FY2017 Projected |
FY2018 GAA |
|
|---|---|---|---|---|---|
| Historical Budget Levels | 257,513,275 | 253,400,576 | 277,281,180 | 276,321,345 | 281,231,181 |
* GAA is General Appropriation Act.
| SPENDING CATEGORY |
FY2014 Expended |
FY2015 Expended |
FY2016 Expended |
FY2017 Projected |
FY2018 GAA |
|---|---|---|---|---|---|
| Wages & Salaries | 1,833 | 1,792 | 2,409 | 1,878 | 1,860 |
| Employee Benefits | 64 | 69 | 66 | 73 | 76 |
| Operating Expenses | 253 | 262 | 253 | 251 | 258 |
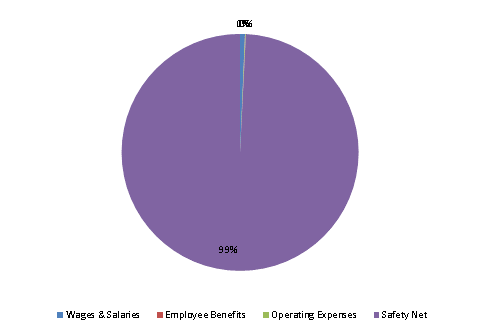
| Safety Net | 248,160 | 251,120 | 267,169 | 273,469 | 279,037 |
| Grants & Subsidies | 0 | 0 | 138 | 650 | 0 |
| Debt Service | 0 | 0 | 0 | 0 | 0 |
| TOTAL | 250,309 | 253,243 | 270,035 | 276,321 | 281,231 |
FY2018 Spending Category Chart
