|
FY2018 House 1 |
FY2018 House Final |
FY2018 Senate Final |
FY2018 GAA |
|
|---|---|---|---|---|
| Budget Tracking | 4,416,446 | 4,666,445 | 4,416,446 | 4,666,445 |
|
FY2015 GAA |
FY2016 GAA |
FY2017 GAA |
FY2017 Projected |
FY2018 GAA |
|
|---|---|---|---|---|---|
| Historical Budget Levels | 4,421,323 | 4,396,323 | 4,671,322 | 4,622,297 | 4,666,445 |
* GAA is General Appropriation Act.
| SPENDING CATEGORY |
FY2014 Expended |
FY2015 Expended |
FY2016 Expended |
FY2017 Projected |
FY2018 GAA |
|---|---|---|---|---|---|
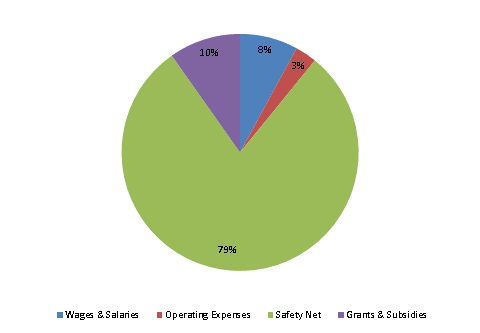
| Wages & Salaries | 325 | 350 | 600 | -83 | 370 |
| Operating Expenses | 120 | 138 | 138 | 128 | 137 |
| Safety Net | 3,142 | 3,451 | 3,398 | 3,711 | 3,703 |
| Grants & Subsidies | 655 | 511 | 509 | 867 | 456 |
| Debt Service | 0 | 0 | 0 | 0 | 0 |
| TOTAL | 4,241 | 4,450 | 4,645 | 4,622 | 4,666 |
FY2018 Spending Category Chart
