|
FY2018 House 1 |
FY2018 House Final |
FY2018 Senate Final |
FY2018 GAA |
|
|---|---|---|---|---|
| Budget Tracking | 11,769,863 | 13,459,864 | 12,769,863 | 14,103,767 |
|
FY2015 GAA |
FY2016 GAA |
FY2017 GAA |
FY2017 Projected |
FY2018 GAA |
|
|---|---|---|---|---|---|
| Historical Budget Levels | 13,778,657 | 13,425,796 | 14,352,257 | 12,380,059 | 14,103,767 |
* GAA is General Appropriation Act.
| SPENDING CATEGORY |
FY2014 Expended |
FY2015 Expended |
FY2016 Expended |
FY2017 Projected |
FY2018 GAA |
|---|---|---|---|---|---|
| Wages & Salaries | 8,587 | 7,447 | 6,726 | 6,606 | 7,623 |
| Employee Benefits | 116 | 111 | 105 | 104 | 127 |
| Operating Expenses | 5,084 | 5,284 | 5,400 | 5,268 | 6,354 |
| Grants & Subsidies | 626 | 109 | 1,200 | 331 | 0 |
| Debt Service | 0 | 0 | 0 | 71 | 0 |
| TOTAL | 14,413 | 12,951 | 13,430 | 12,380 | 14,104 |
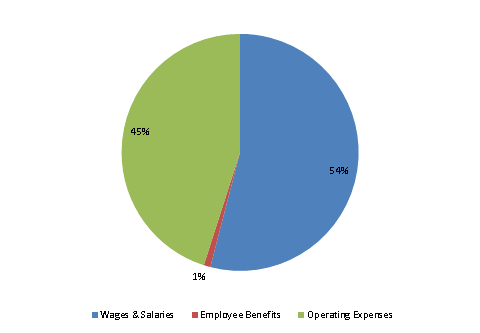
FY2018 Spending Category Chart