|
FY2018 House 1 |
FY2018 House Final |
FY2018 Senate Final |
FY2018 GAA |
|
|---|---|---|---|---|
| Budget Tracking | 14,130,740 | 13,762,080 | 14,130,740 | 13,349,218 |
|
FY2015 GAA |
FY2016 GAA |
FY2017 GAA |
FY2017 Projected |
FY2018 GAA |
|
|---|---|---|---|---|---|
| Historical Budget Levels | 13,612,080 | 14,411,732 | 13,612,080 | 12,947,287 | 13,349,218 |
* GAA is General Appropriation Act.
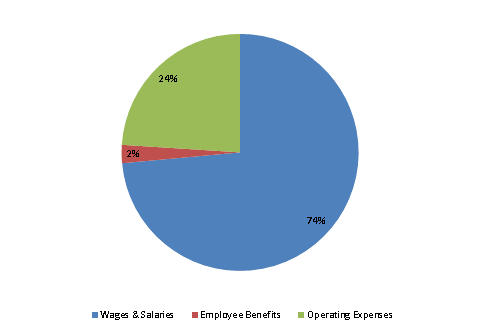
| SPENDING CATEGORY |
FY2014 Expended |
FY2015 Expended |
FY2016 Expended |
FY2017 Projected |
FY2018 GAA |
|---|---|---|---|---|---|
| Wages & Salaries | 8,098 | 8,692 | 9,270 | 9,283 | 9,816 |
| Employee Benefits | 347 | 302 | 303 | 344 | 331 |
| Operating Expenses | 3,045 | 3,006 | 2,916 | 3,320 | 3,202 |
| TOTAL | 11,490 | 12,000 | 12,489 | 12,947 | 13,349 |
FY2018 Spending Category Chart