|
FY2018 House 1 |
FY2018 House Final |
FY2018 Senate Final |
FY2018 GAA |
|
|---|---|---|---|---|
| Budget Tracking | 6,888,469 | 7,823,468 | 7,768,469 | 8,158,469 |
|
FY2015 GAA |
FY2016 GAA |
FY2017 GAA |
FY2017 Projected |
FY2018 GAA |
|
|---|---|---|---|---|---|
| Historical Budget Levels | 7,785,144 | 7,250,142 | 7,702,921 | 6,480,211 | 8,158,469 |
* GAA is General Appropriation Act.
| SPENDING CATEGORY |
FY2014 Expended |
FY2015 Expended |
FY2016 Expended |
FY2017 Projected |
FY2018 GAA |
|---|---|---|---|---|---|
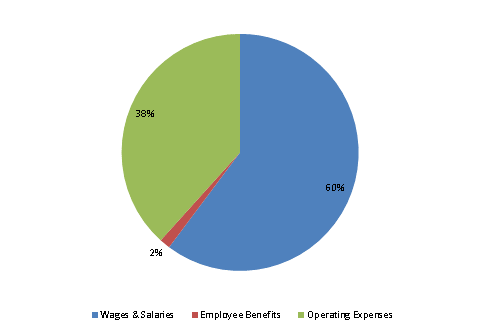
| Wages & Salaries | 4,006 | 4,240 | 4,363 | 4,150 | 4,913 |
| Employee Benefits | 69 | 78 | 88 | 101 | 119 |
| Operating Expenses | 2,168 | 2,033 | 2,160 | 2,200 | 3,126 |
| Grants & Subsidies | 600 | 673 | 930 | 30 | 0 |
| TOTAL | 6,842 | 7,024 | 7,542 | 6,480 | 8,158 |
FY2018 Spending Category Chart
