|
FY2018 House 1 |
FY2018 House Final |
FY2018 Senate Final |
FY2018 GAA |
|
|---|---|---|---|---|
| Budget Tracking | 20,308,835 | 20,133,943 | 20,308,835 | 19,633,943 |
|
FY2015 GAA |
FY2016 GAA |
FY2017 GAA |
FY2017 Projected |
FY2018 GAA |
|
|---|---|---|---|---|---|
| Historical Budget Levels | 19,852,999 | 19,830,000 | 19,412,000 | 18,715,016 | 19,633,943 |
* GAA is General Appropriation Act.
| SPENDING CATEGORY |
FY2014 Expended |
FY2015 Expended |
FY2016 Expended |
FY2017 Projected |
FY2018 GAA |
|---|---|---|---|---|---|
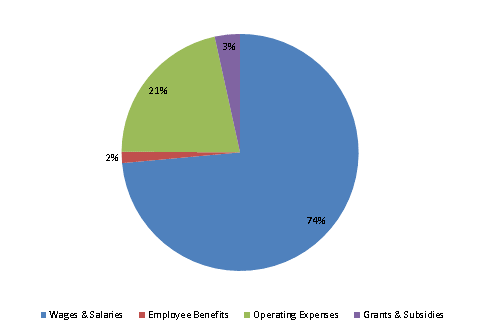
| Wages & Salaries | 13,518 | 13,722 | 13,842 | 13,543 | 14,442 |
| Employee Benefits | 224 | 246 | 382 | 297 | 301 |
| Operating Expenses | 3,580 | 3,575 | 3,651 | 4,175 | 4,214 |
| Grants & Subsidies | 636 | 576 | 575 | 700 | 677 |
| TOTAL | 17,958 | 18,120 | 18,450 | 18,715 | 19,634 |
FY2018 Spending Category Chart
