|
FY2018 House 1 |
FY2018 House Final |
FY2018 Senate Final |
FY2018 GAA |
|
|---|---|---|---|---|
| Budget Tracking | 2,066,244 | 2,366,244 | 2,491,244 | 2,679,257 |
|
FY2015 GAA |
FY2016 GAA |
FY2017 GAA |
FY2017 Projected |
FY2018 GAA |
|
|---|---|---|---|---|---|
| Historical Budget Levels | 1,473,312 | 2,320,994 | 2,501,996 | 2,011,232 | 2,679,257 |
* GAA is General Appropriation Act.
| SPENDING CATEGORY |
FY2014 Expended |
FY2015 Expended |
FY2016 Expended |
FY2017 Projected |
FY2018 GAA |
|---|---|---|---|---|---|
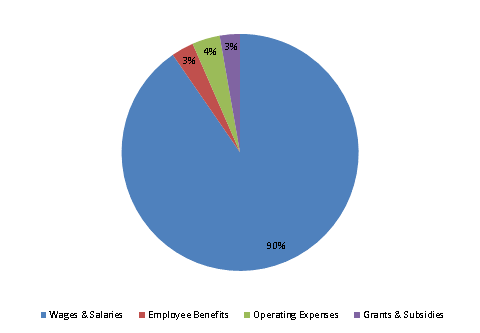
| Wages & Salaries | 389 | 1,148 | 2,026 | 1,865 | 2,422 |
| Employee Benefits | 9 | 24 | 56 | 68 | 82 |
| Operating Expenses | 34 | 31 | 55 | 79 | 102 |
| Grants & Subsidies | 0 | 53 | 400 | 0 | 74 |
| TOTAL | 432 | 1,255 | 2,536 | 2,011 | 2,679 |
FY2018 Spending Category Chart
