|
FY2018 House 1 |
FY2018 House Final |
FY2018 Senate Final |
FY2018 GAA |
|
|---|---|---|---|---|
| Budget Tracking | 106,970,644 | 106,970,644 | 106,220,644 | 103,956,247 |
|
FY2015 GAA |
FY2016 GAA |
FY2017 GAA |
FY2017 Projected |
FY2018 GAA |
|
|---|---|---|---|---|---|
| Historical Budget Levels | 107,480,864 | 112,092,314 | 109,353,183 | 107,793,814 | 103,956,247 |
* GAA is General Appropriation Act.
| SPENDING CATEGORY |
FY2014 Expended |
FY2015 Expended |
FY2016 Expended |
FY2017 Projected |
FY2018 GAA |
|---|---|---|---|---|---|
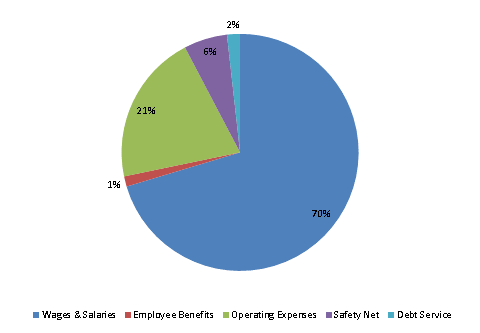
| Wages & Salaries | 92,458 | 80,221 | 77,185 | 78,139 | 73,130 |
| Employee Benefits | 1,750 | 1,594 | 1,589 | 1,489 | 1,455 |
| Operating Expenses | 26,681 | 22,384 | 20,791 | 21,406 | 21,369 |
| Safety Net | 7,569 | 5,595 | 6,035 | 4,868 | 6,164 |
| Debt Service | 367 | 1,892 | 1,892 | 1,892 | 1,838 |
| TOTAL | 128,825 | 111,685 | 107,491 | 107,794 | 103,956 |
FY2018 Spending Category Chart
