|
FY2018 House 1 |
FY2018 House Final |
FY2018 Senate Final |
FY2018 GAA |
|
|---|---|---|---|---|
| Budget Tracking | 6,474,349 | 6,474,349 | 6,474,349 | 6,474,349 |
|
FY2015 GAA |
FY2016 GAA |
FY2017 GAA |
FY2017 Projected |
FY2018 GAA |
|
|---|---|---|---|---|---|
| Historical Budget Levels | 5,621,357 | 5,585,431 | 6,482,207 | 6,051,969 | 6,474,349 |
* GAA is General Appropriation Act.
| SPENDING CATEGORY |
FY2014 Expended |
FY2015 Expended |
FY2016 Expended |
FY2017 Projected |
FY2018 GAA |
|---|---|---|---|---|---|
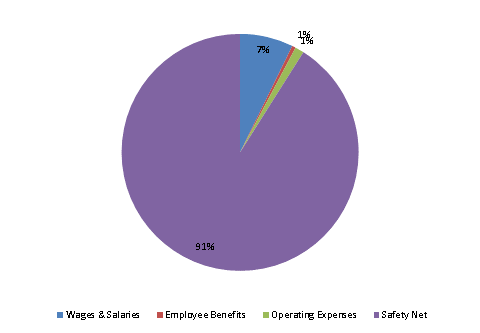
| Wages & Salaries | 454 | 501 | 470 | 478 | 470 |
| Employee Benefits | 27 | 29 | 28 | 32 | 32 |
| Operating Expenses | 72 | 71 | 62 | 79 | 79 |
| Safety Net | 4,855 | 5,005 | 5,160 | 5,463 | 5,893 |
| TOTAL | 5,409 | 5,607 | 5,719 | 6,052 | 6,474 |
FY2018 Spending Category Chart
