|
FY2018 House 1 |
FY2018 House Final |
FY2018 Senate Final |
FY2018 GAA |
|
|---|---|---|---|---|
| Budget Tracking | 63,779,097 | 63,779,097 | 63,779,097 | 63,532,818 |
|
FY2015 GAA |
FY2016 GAA |
FY2017 GAA |
FY2017 Projected |
FY2018 GAA |
|
|---|---|---|---|---|---|
| Historical Budget Levels | 54,933,705 | 59,802,269 | 62,846,395 | 61,271,452 | 63,532,818 |
* GAA is General Appropriation Act.
| SPENDING CATEGORY |
FY2014 Expended |
FY2015 Expended |
FY2016 Expended |
FY2017 Projected |
FY2018 GAA |
|---|---|---|---|---|---|
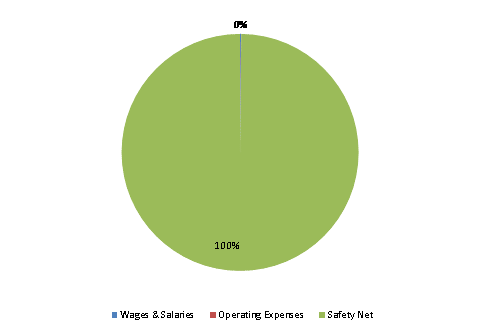
| Wages & Salaries | 0 | 70 | 80 | 80 | 80 |
| Operating Expenses | 6 | 11 | 8 | 17 | 17 |
| Safety Net | 51,538 | 46,933 | 54,547 | 61,174 | 63,436 |
| TOTAL | 51,544 | 47,014 | 54,635 | 61,271 | 63,533 |
FY2018 Spending Category Chart
