|
FY2018 House 1 |
FY2018 House Final |
FY2018 Senate Final |
FY2018 GAA |
|
|---|---|---|---|---|
| Budget Tracking | 216,612,361 | 216,612,361 | 216,792,361 | 208,097,398 |
|
FY2015 GAA |
FY2016 GAA |
FY2017 GAA |
FY2017 Projected |
FY2018 GAA |
|
|---|---|---|---|---|---|
| Historical Budget Levels | 206,309,615 | 214,737,045 | 218,453,948 | 217,191,925 | 208,097,398 |
* GAA is General Appropriation Act.
| SPENDING CATEGORY |
FY2014 Expended |
FY2015 Expended |
FY2016 Expended |
FY2017 Projected |
FY2018 GAA |
|---|---|---|---|---|---|
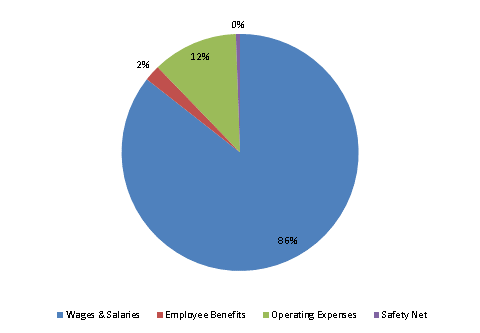
| Wages & Salaries | 165,941 | 179,748 | 182,784 | 186,859 | 178,100 |
| Employee Benefits | 4,072 | 4,342 | 4,587 | 4,674 | 4,543 |
| Operating Expenses | 22,340 | 24,026 | 22,699 | 24,410 | 24,254 |
| Safety Net | 645 | 730 | 1,088 | 1,249 | 1,200 |
| TOTAL | 192,998 | 208,846 | 211,158 | 217,192 | 208,097 |
FY2018 Spending Category Chart
