|
FY2018 House 1 |
FY2018 House Final |
FY2018 Senate Final |
FY2018 GAA |
|
|---|---|---|---|---|
| Budget Tracking | 1,170,331,170 | 1,170,331,170 | 1,170,331,170 | 1,164,904,714 |
|
FY2015 GAA |
FY2016 GAA |
FY2017 GAA |
FY2017 Projected |
FY2018 GAA |
|
|---|---|---|---|---|---|
| Historical Budget Levels | 1,006,339,270 | 1,084,666,856 | 1,110,427,449 | 1,118,161,928 | 1,164,904,714 |
* GAA is General Appropriation Act.
| SPENDING CATEGORY |
FY2014 Expended |
FY2015 Expended |
FY2016 Expended |
FY2017 Projected |
FY2018 GAA |
|---|---|---|---|---|---|
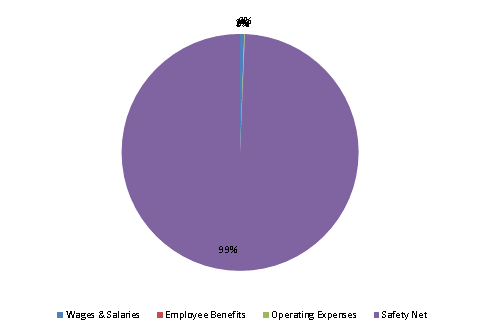
| Wages & Salaries | 6,164 | 6,335 | 5,691 | 6,514 | 6,396 |
| Employee Benefits | 195 | 233 | 210 | 255 | 254 |
| Operating Expenses | 996 | 740 | 913 | 985 | 981 |
| Safety Net | 844,395 | 1,028,524 | 1,074,227 | 1,110,408 | 1,157,274 |
| TOTAL | 851,750 | 1,035,833 | 1,081,042 | 1,118,162 | 1,164,905 |
FY2018 Spending Category Chart
