|
FY2018 House 1 |
FY2018 House Final |
FY2018 Senate Final |
FY2018 GAA |
|
|---|---|---|---|---|
| Budget Tracking | 69,797,140 | 69,797,141 | 69,847,140 | 67,753,226 |
|
FY2015 GAA |
FY2016 GAA |
FY2017 GAA |
FY2017 Projected |
FY2018 GAA |
|
|---|---|---|---|---|---|
| Historical Budget Levels | 65,690,438 | 69,918,985 | 70,068,991 | 69,541,962 | 67,753,226 |
* GAA is General Appropriation Act.
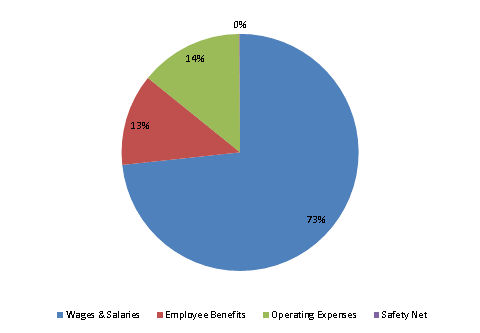
| SPENDING CATEGORY |
FY2014 Expended |
FY2015 Expended |
FY2016 Expended |
FY2017 Projected |
FY2018 GAA |
|---|---|---|---|---|---|
| Wages & Salaries | 49,031 | 49,588 | 50,181 | 52,504 | 49,672 |
| Employee Benefits | 7,252 | 7,794 | 7,999 | 8,473 | 8,471 |
| Operating Expenses | 7,211 | 6,920 | 7,471 | 8,490 | 9,537 |
| Safety Net | 100 | 200 | 100 | 75 | 73 |
| TOTAL | 63,594 | 64,502 | 65,751 | 69,542 | 67,753 |
FY2018 Spending Category Chart