|
FY2018 House 1 |
FY2018 House Final |
FY2018 Senate Final |
FY2018 GAA |
|
|---|---|---|---|---|
| Budget Tracking | 24,145,684 | 24,145,685 | 24,145,685 | 24,101,834 |
|
FY2015 GAA |
FY2016 GAA |
FY2017 GAA |
FY2017 Projected |
FY2018 GAA |
|
|---|---|---|---|---|---|
| Historical Budget Levels | 36,416,490 | 24,258,428 | 24,101,834 | 24,089,973 | 24,101,834 |
* GAA is General Appropriation Act.
| SPENDING CATEGORY |
FY2014 Expended |
FY2015 Expended |
FY2016 Expended |
FY2017 Projected |
FY2018 GAA |
|---|---|---|---|---|---|
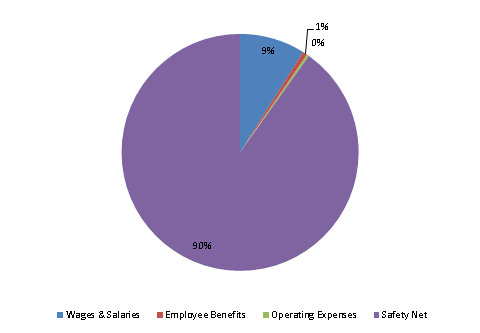
| Wages & Salaries | 2,738 | 2,977 | 2,664 | 2,939 | 2,156 |
| Employee Benefits | 111 | 123 | 103 | 141 | 146 |
| Operating Expenses | 49 | 51 | 26 | 68 | 74 |
| Safety Net | 31,986 | 27,735 | 20,738 | 20,942 | 21,726 |
| TOTAL | 34,884 | 30,885 | 23,531 | 24,090 | 24,102 |
FY2018 Spending Category Chart
