|
FY2018 House 1 |
FY2018 House Final |
FY2018 Senate Final |
FY2018 GAA |
|
|---|---|---|---|---|
| Budget Tracking | 387,630,579 | 388,380,579 | 388,380,580 | 387,080,579 |
|
FY2015 GAA |
FY2016 GAA |
FY2017 GAA |
FY2017 Projected |
FY2018 GAA |
|
|---|---|---|---|---|---|
| Historical Budget Levels | 360,697,453 | 370,816,250 | 379,754,252 | 375,286,905 | 387,080,579 |
* GAA is General Appropriation Act.
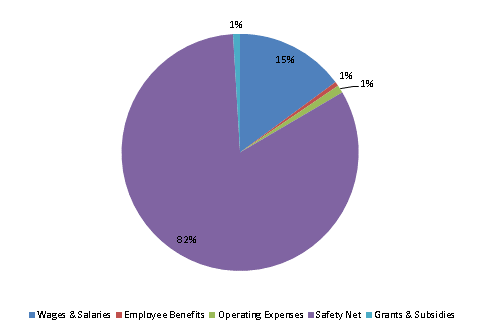
| SPENDING CATEGORY |
FY2014 Expended |
FY2015 Expended |
FY2016 Expended |
FY2017 Projected |
FY2018 GAA |
|---|---|---|---|---|---|
| Wages & Salaries | 54,608 | 57,132 | 55,941 | 58,383 | 57,632 |
| Employee Benefits | 1,921 | 2,034 | 2,055 | 2,309 | 2,327 |
| Operating Expenses | 3,575 | 3,268 | 3,310 | 3,499 | 4,112 |
| Safety Net | 290,376 | 284,056 | 311,527 | 309,474 | 319,318 |
| Grants & Subsidies | 799 | 903 | 1,131 | 1,622 | 3,692 |
| TOTAL | 351,279 | 347,393 | 373,964 | 375,287 | 387,081 |
FY2018 Spending Category Chart