|
FY2018 House 1 |
FY2018 House Final |
FY2018 Senate Final |
FY2018 GAA |
|
|---|---|---|---|---|
| Budget Tracking | 88,906,785 | 89,206,786 | 91,581,786 | 91,738,321 |
|
FY2015 GAA |
FY2016 GAA |
FY2017 GAA |
FY2017 Projected |
FY2018 GAA |
|
|---|---|---|---|---|---|
| Historical Budget Levels | 87,567,266 | 80,420,672 | 88,650,618 | 83,340,703 | 91,738,321 |
* GAA is General Appropriation Act.
| SPENDING CATEGORY |
FY2014 Expended |
FY2015 Expended |
FY2016 Expended |
FY2017 Projected |
FY2018 GAA |
|---|---|---|---|---|---|
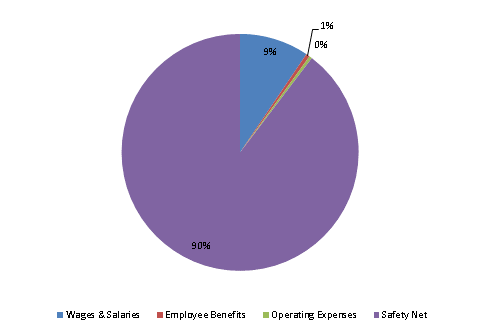
| Wages & Salaries | 6,629 | 7,532 | 7,691 | 8,454 | 8,670 |
| Employee Benefits | 334 | 386 | 418 | 450 | 465 |
| Operating Expenses | 252 | 401 | 272 | 263 | 362 |
| Safety Net | 64,089 | 67,081 | 70,949 | 74,550 | 82,241 |
| Debt Service | 0 | 0 | 0 | -376 | 0 |
| TOTAL | 71,304 | 75,399 | 79,330 | 83,341 | 91,738 |
FY2018 Spending Category Chart
