|
FY2018 House 1 |
FY2018 House Final |
FY2018 Senate Final |
FY2018 GAA |
|
|---|---|---|---|---|
| Budget Tracking | 279,454,551 | 280,439,700 | 280,464,507 | 278,593,375 |
|
FY2015 GAA |
FY2016 GAA |
FY2017 GAA |
FY2017 Projected |
FY2018 GAA |
|
|---|---|---|---|---|---|
| Historical Budget Levels | 216,417,590 | 249,564,682 | 265,126,535 | 278,291,530 | 278,593,375 |
* GAA is General Appropriation Act.
| SPENDING CATEGORY |
FY2014 Expended |
FY2015 Expended |
FY2016 Expended |
FY2017 Projected |
FY2018 GAA |
|---|---|---|---|---|---|
| Wages & Salaries | 0 | 0 | 22 | 74 | 74 |
| Employee Benefits | 0 | 0 | 0 | 1 | 1 |
| Operating Expenses | 89 | 231 | 108 | 1,884 | 1,878 |
| Safety Net | 213,505 | 243,240 | 257,210 | 276,332 | 276,640 |
| TOTAL | 213,594 | 243,471 | 257,340 | 278,292 | 278,593 |
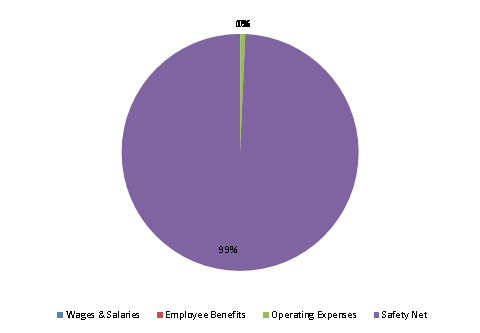
FY2018 Spending Category Chart