|
FY2018 House 1 |
FY2018 House Final |
FY2018 Senate Final |
FY2018 GAA |
|
|---|---|---|---|---|
| Budget Tracking | 292,138,783 | 292,423,782 | 292,531,283 | 289,964,283 |
|
FY2015 GAA |
FY2016 GAA |
FY2017 GAA |
FY2017 Projected |
FY2018 GAA |
|
|---|---|---|---|---|---|
| Historical Budget Levels | 261,553,353 | 277,494,460 | 283,687,851 | 286,466,300 | 289,964,283 |
* GAA is General Appropriation Act.
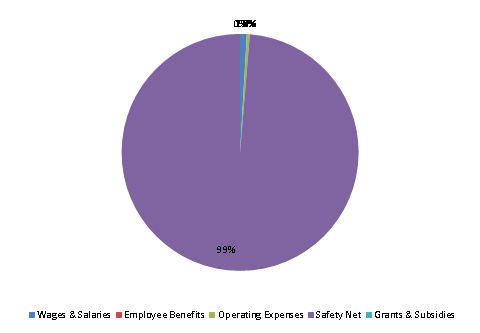
| SPENDING CATEGORY |
FY2014 Expended |
FY2015 Expended |
FY2016 Expended |
FY2017 Projected |
FY2018 GAA |
|---|---|---|---|---|---|
| Wages & Salaries | 1,044 | 1,118 | 1,075 | 2,860 | 2,600 |
| Employee Benefits | 6 | 7 | 9 | 88 | 72 |
| Operating Expenses | 706 | 470 | 2,307 | 1,421 | 1,131 |
| Safety Net | 252,453 | 267,795 | 278,887 | 282,047 | 286,149 |
| Grants & Subsidies | 25 | 25 | 25 | 50 | 12 |
| TOTAL | 254,234 | 269,416 | 282,303 | 286,466 | 289,964 |
FY2018 Spending Category Chart