|
FY2018 House 1 |
FY2018 House Final |
FY2018 Senate Final |
FY2018 GAA |
|
|---|---|---|---|---|
| Budget Tracking | 100,134,611 | 100,134,611 | 100,134,611 | 98,384,611 |
|
FY2015 GAA |
FY2016 GAA |
FY2017 GAA |
FY2017 Projected |
FY2018 GAA |
|
|---|---|---|---|---|---|
| Historical Budget Levels | 74,871,347 | 80,703,821 | 95,614,734 | 94,458,172 | 98,384,611 |
* GAA is General Appropriation Act.
| SPENDING CATEGORY |
FY2014 Expended |
FY2015 Expended |
FY2016 Expended |
FY2017 Projected |
FY2018 GAA |
|---|---|---|---|---|---|
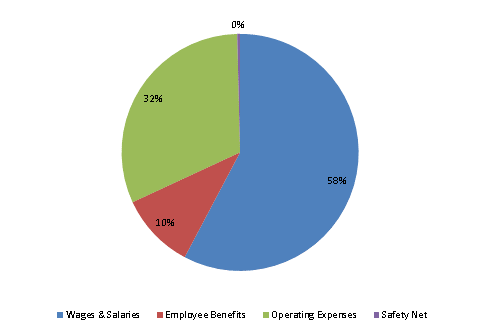
| Wages & Salaries | 41,592 | 43,469 | 44,349 | 55,571 | 56,804 |
| Employee Benefits | 6,193 | 7,869 | 8,270 | 10,084 | 10,186 |
| Operating Expenses | 22,274 | 24,729 | 25,011 | 28,411 | 31,010 |
| Safety Net | 0 | 1 | 406 | 392 | 385 |
| TOTAL | 70,059 | 76,068 | 78,037 | 94,458 | 98,385 |
FY2018 Spending Category Chart
