|
FY2018 House 1 |
FY2018 House Final |
FY2018 Senate Final |
FY2018 GAA |
|
|---|---|---|---|---|
| Budget Tracking | 1,339,227 | 1,339,228 | 1,339,227 | 1,337,124 |
|
FY2015 GAA |
FY2016 GAA |
FY2017 GAA |
FY2017 Projected |
FY2018 GAA |
|
|---|---|---|---|---|---|
| Historical Budget Levels | 1,328,039 | 1,334,449 | 1,337,124 | 1,333,525 | 1,337,124 |
* GAA is General Appropriation Act.
| SPENDING CATEGORY |
FY2014 Expended |
FY2015 Expended |
FY2016 Expended |
FY2017 Projected |
FY2018 GAA |
|---|---|---|---|---|---|
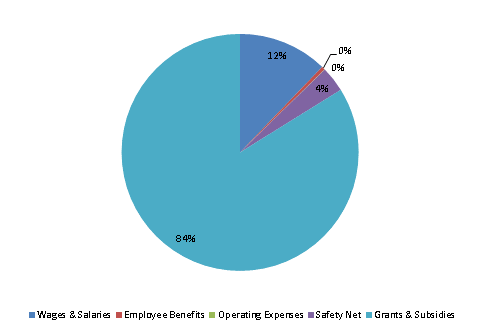
| Wages & Salaries | 140 | 152 | 130 | 161 | 163 |
| Employee Benefits | 2 | 4 | 4 | 6 | 6 |
| Operating Expenses | 0 | 0 | 0 | 1 | 0 |
| Safety Net | 99 | 102 | 64 | 43 | 46 |
| Grants & Subsidies | 1,248 | 1,058 | 1,106 | 1,123 | 1,121 |
| TOTAL | 1,489 | 1,317 | 1,303 | 1,334 | 1,337 |
FY2018 Spending Category Chart
