|
FY2018 House 1 |
FY2018 House Final |
FY2018 Senate Final |
FY2018 GAA |
|
|---|---|---|---|---|
| Budget Tracking | 156,920,732 | 157,070,732 | 155,920,732 | 155,400,383 |
|
FY2015 GAA |
FY2016 GAA |
FY2017 GAA |
FY2017 Projected |
FY2018 GAA |
|
|---|---|---|---|---|---|
| Historical Budget Levels | 148,265,923 | 154,536,238 | 155,250,383 | 150,735,028 | 155,400,383 |
* GAA is General Appropriation Act.
| SPENDING CATEGORY |
FY2014 Expended |
FY2015 Expended |
FY2016 Expended |
FY2017 Projected |
FY2018 GAA |
|---|---|---|---|---|---|
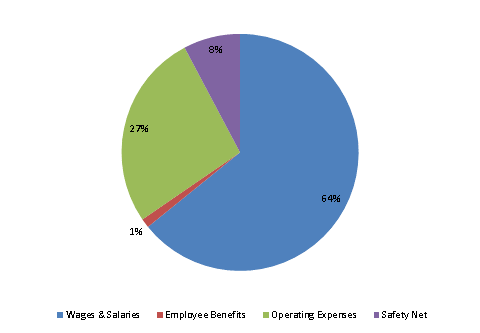
| Wages & Salaries | 94,903 | 98,070 | 95,017 | 98,643 | 99,734 |
| Employee Benefits | 1,592 | 1,804 | 1,978 | 1,934 | 1,927 |
| Operating Expenses | 36,613 | 37,901 | 38,228 | 38,201 | 41,692 |
| Safety Net | 12,075 | 12,049 | 11,813 | 11,957 | 12,048 |
| TOTAL | 145,183 | 149,824 | 147,036 | 150,735 | 155,400 |
FY2018 Spending Category Chart
