|
FY2018 House 1 |
FY2018 House Final |
FY2018 Senate Final |
FY2018 GAA |
|
|---|---|---|---|---|
| Budget Tracking | 3,833,878 | 3,833,878 | 3,833,878 | 3,718,862 |
|
FY2015 GAA |
FY2016 GAA |
FY2017 GAA |
FY2017 Projected |
FY2018 GAA |
|
|---|---|---|---|---|---|
| Historical Budget Levels | 3,868,096 | 3,868,096 | 3,866,096 | 3,833,039 | 3,718,862 |
* GAA is General Appropriation Act.
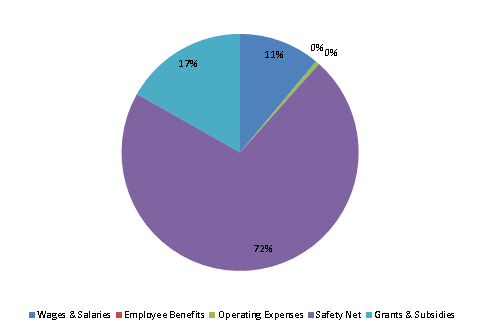
| SPENDING CATEGORY |
FY2014 Expended |
FY2015 Expended |
FY2016 Expended |
FY2017 Projected |
FY2018 GAA |
|---|---|---|---|---|---|
| Wages & Salaries | 509 | 495 | 462 | 424 | 411 |
| Employee Benefits | 2 | 1 | 0 | 0 | 0 |
| Operating Expenses | 20 | 20 | 12 | 21 | 20 |
| Safety Net | 2,749 | 2,677 | 2,632 | 2,744 | 2,662 |
| Grants & Subsidies | 646 | 639 | 644 | 644 | 625 |
| TOTAL | 3,927 | 3,832 | 3,750 | 3,833 | 3,719 |
FY2018 Spending Category Chart