|
FY2018 House 1 |
FY2018 House Final |
FY2018 Senate Final |
FY2018 GAA |
|
|---|---|---|---|---|
| Budget Tracking | 615,693 | 615,693 | 615,693 | 615,693 |
|
FY2015 GAA |
FY2016 GAA |
FY2017 GAA |
FY2017 Projected |
FY2018 GAA |
|
|---|---|---|---|---|---|
| Historical Budget Levels | 683,545 | 382,664 | 615,693 | 535,386 | 615,693 |
* GAA is General Appropriation Act.
| SPENDING CATEGORY |
FY2014 Expended |
FY2015 Expended |
FY2016 Expended |
FY2017 Projected |
FY2018 GAA |
|---|---|---|---|---|---|
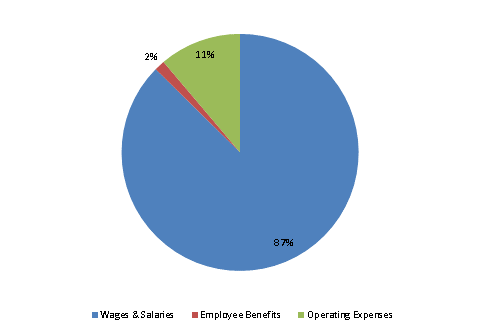
| Wages & Salaries | 466 | 505 | 499 | 447 | 538 |
| Employee Benefits | 7 | 8 | 8 | 9 | 9 |
| Operating Expenses | 95 | 0 | 0 | 80 | 69 |
| TOTAL | 568 | 513 | 507 | 535 | 616 |
FY2018 Spending Category Chart
